farmsolarpanels Solar for farm buildings, UK wide Book a roof survey

Specialist solar panels for farms across the UK

A farm roof is usually the cheapest source of energy the business will ever own. We survey it, model what the frame can carry, and arrange the design, the grid application and the installation through our MCS-certified partner.

UK wide  /  roof or land  /  energy survey first

Book a farm roof survey
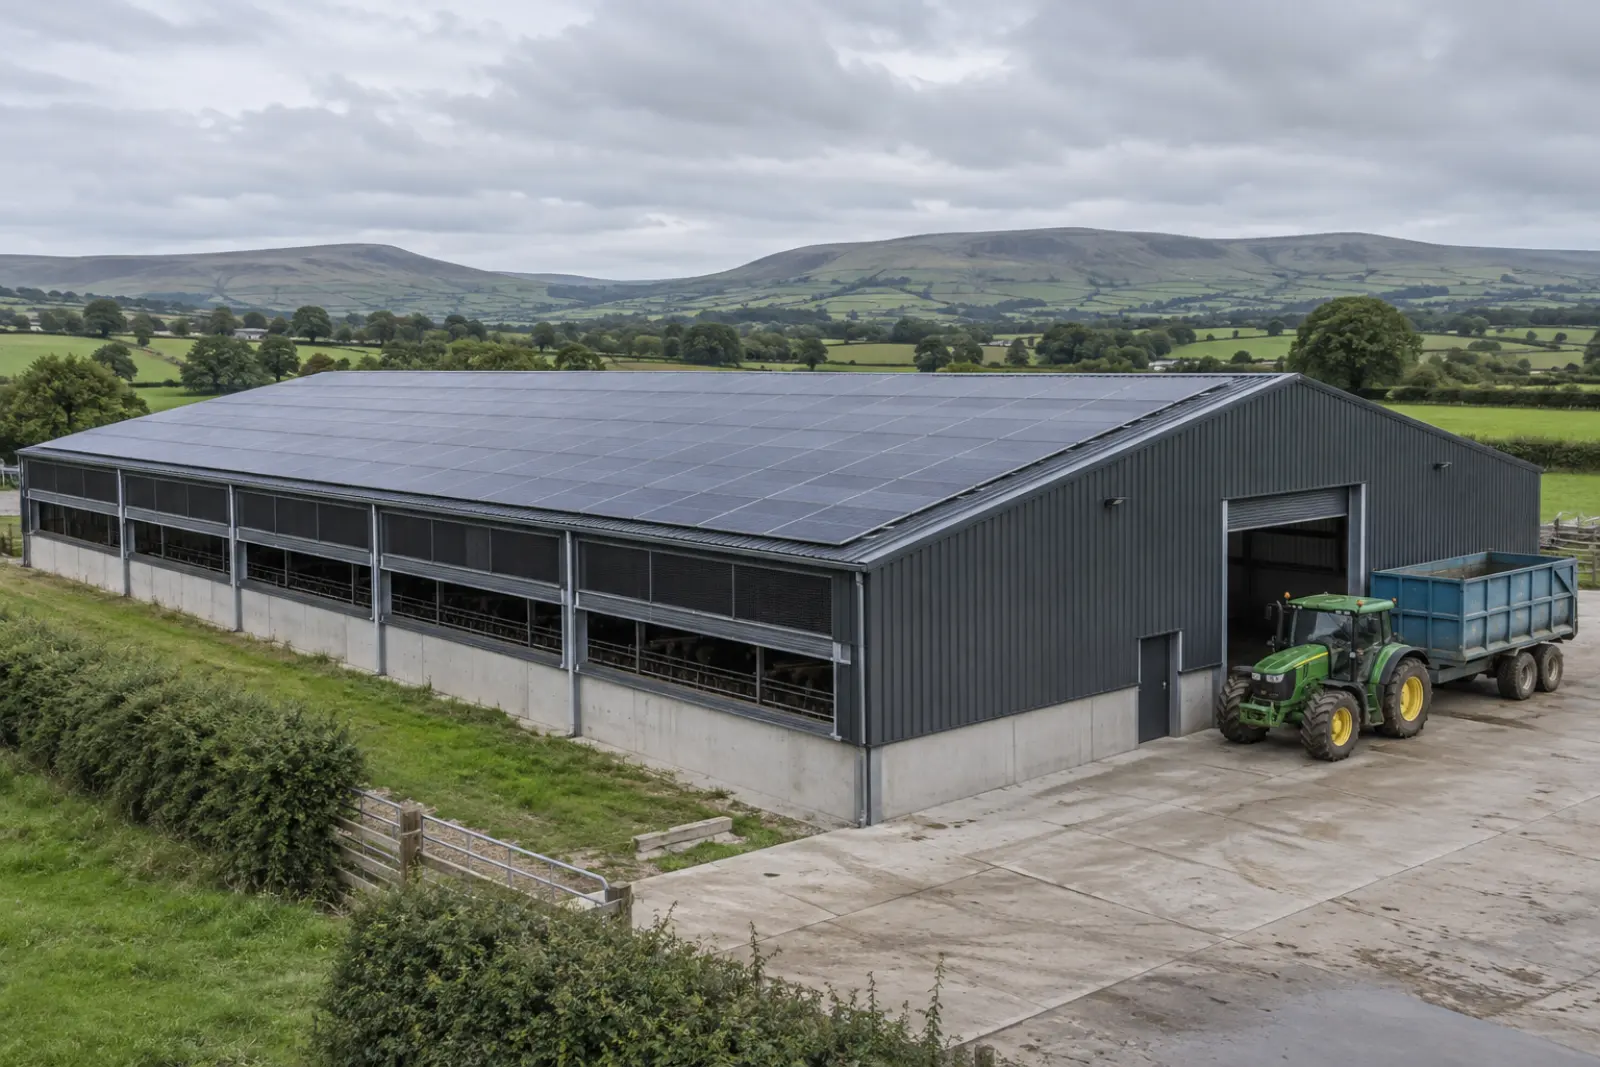
A modern steel framed agricultural building with its roof covered in solar panels, tractor and trailer in the yard, fields beyond

How agricultural rooftop solar works on a farm building

Agricultural rooftop solar is a photovoltaic array mounted on a farm building that converts daylight into electricity the farm consumes before it draws anything from the grid. The solar panels sit on the existing steel portal frame, the inverter turns direct current into the alternating current your board already uses, and any electricity the holding does not consume is exported under a Smart Export Guarantee tariff, which has run since the introduction of the scheme in 2020 (Ofgem). Every unit of energy the buildings take from the array is a unit of energy nobody has to buy.

A farm solar system is not a generator set and it does not replace your energy supply contract. Solar panels cut the volume of electricity you buy during daylight hours, so your energy bills fall in proportion to on-site consumption rather than to what the roof produces. The benefits of solar on farms are real and they are also specific to the building: the same array gives very different results on a machinery store that draws almost nothing and a dairy parlour cooling milk twice a day.

Three things decide whether solar is worth doing on farms: the roof, the load profile and the grid connection. Rising energy costs are what bring most farmers to solar in the first place, but we look at all three before anyone quotes, and we say so plainly when the answer is no. Energy prices are the common thread through every enquiry we take, and the common finding is that the building decides the outcome rather than the panels.

RATIO
2.2 m²
of panel for every kWp installed
SOURCE
Smart Export Guarantee, Ofgem
FIG. 1 Where the electricity goes
PANELS the array on your roof DC INVERTER DC becomes AC AC DISTRIBUTION BOARD USED ON SITE displaces your day rate EXPORTED paid at the SEG rate GRID the split is measured from your meter, never assumed
Self-consumption decides the payback, which is why the survey measures your half hourly demand against modelled generation before anyone quotes.

Which agricultural buildings suit an array best

A farm building suits solar when it carries a large unbroken roof slope, an energy load beneath it worth serving, a frame with capacity to spare, and a covering with years of service life left in it. Most farms have several buildings and only one or two are worth an array, which is why the survey looks at the whole yard rather than the barn you happened to ask about.

Roof pitch and purlin spacing on agricultural buildings differ from the industrial sheds most solar panel companies work on. A general purpose barn is commonly pitched at 15 to 22 degrees rather than the six degrees of a distribution warehouse, which changes row spacing and wind loading, and the purlins are frequently timber or lighter cold rolled sections at wider centres.

The covering is the other difference, and on older farms it is the most common one. Fibre cement sheet, much of it asbestos cement on buildings put up before the mid 1980s, is found across British agriculture and counts as a fragile surface under HSE guidance on fragile roofs. None of that rules an array out. It changes the order of the work, and it is the single most common reason a farm quote and a warehouse quote for the same kWp look nothing alike. Two types of covering account for most of what we find across British farms: profiled steel sheet and fibre cement. A poultry unit put up last year and a poultry shed from 1978 are different projects for that reason alone.

WATCH FOR
Fibre cement sheet, fragile long before it looks it

General purpose building

The usual candidate: a wide span steel portal frame with a long unbroken slope and few penetrations, and normally the largest roof on the holding. Its own energy load is often modest, so self-consumption is the question rather than area.

Grain store

Roof area is generous and the energy demand is lumpy. Drying fans and augers run hard from August into October and the building is close to idle the rest of the year, which pushes more of the generation towards export.

Poultry unit

The strongest match on most farms. Ventilation, lighting and feed systems draw energy through daylight hours all year round, and summer ventilation peaks in exactly the weeks the array is producing most.

Dairy parlour

Milk cooling, vacuum pumps and water heating draw energy twice a day, every day. Morning milking usually starts before the array does, which is where battery storage earns its place rather than being sold as standard.

Machinery store

A large roof with almost no energy load beneath it. Worth using as roof area for an array serving the rest of the yard, rather than for the building's own consumption, which is close to nothing.

Packhouse or cold store

Refrigeration runs through the working day and peaks in warm weather. Of all the building types on a farm, this is the one where generation and energy demand line up most closely across the year.

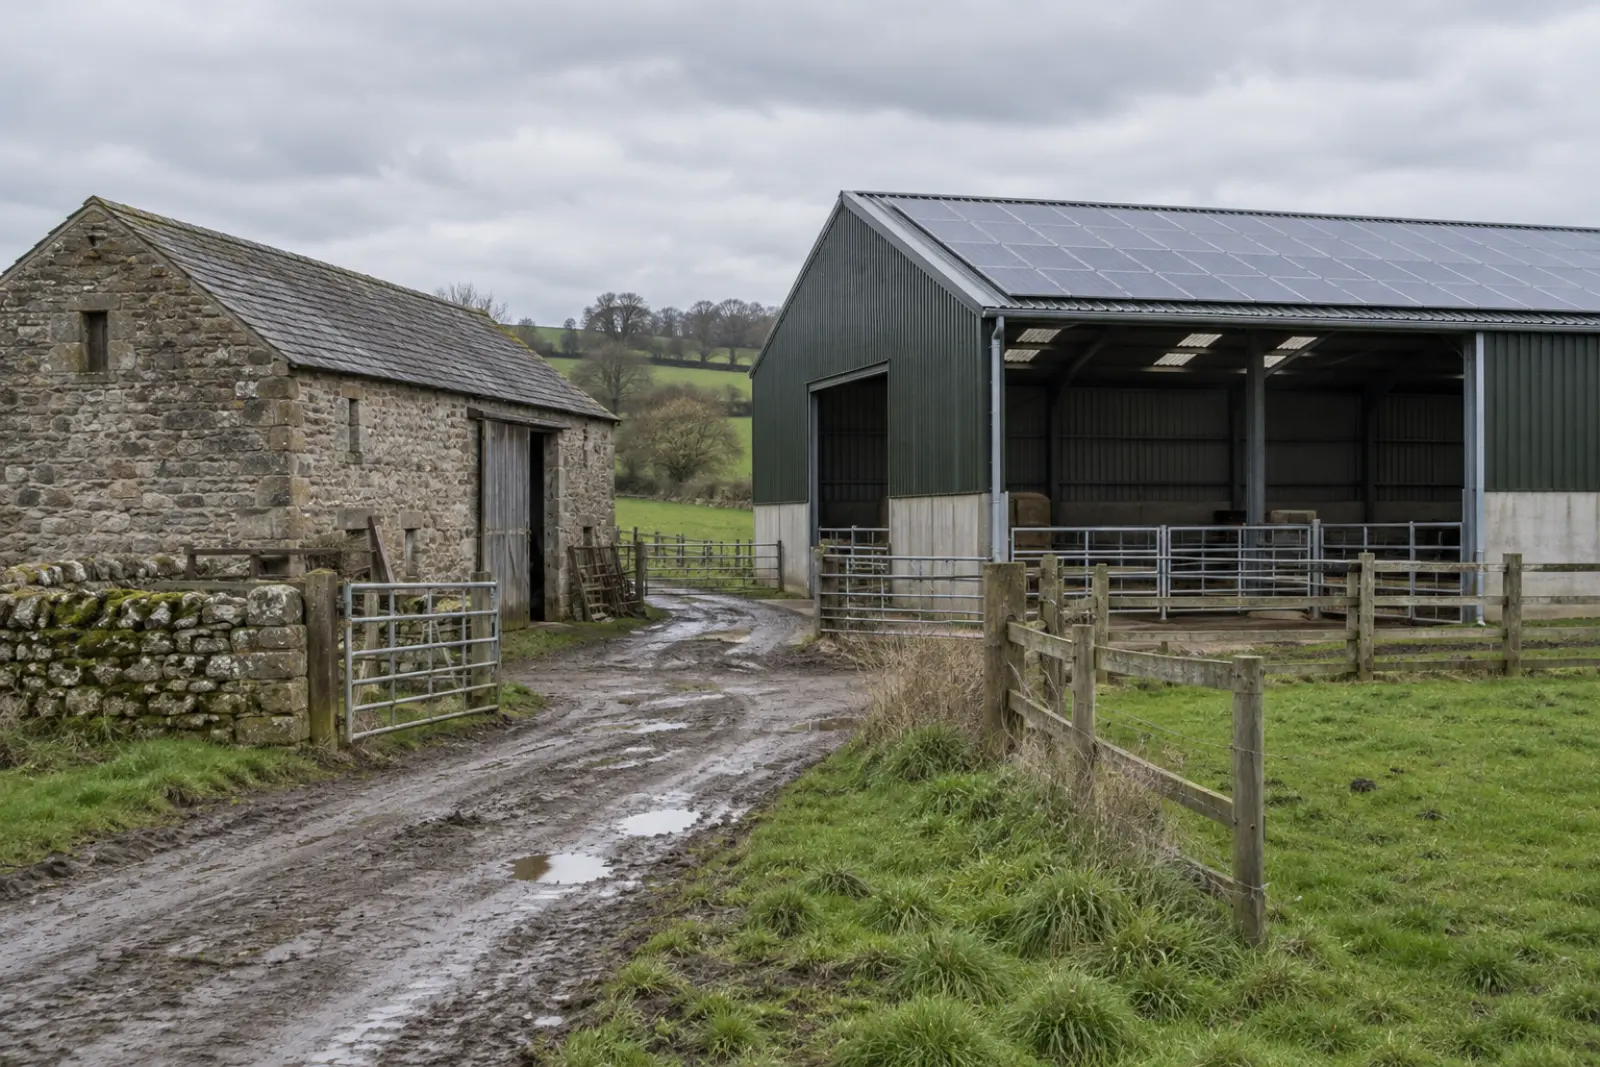
A traditional stone barn beside a modern farm building whose roof carries a solar array
A traditional stone range beside a modern steel framed building carrying an array. Pitch and purlin centres on agricultural buildings differ from industrial sheds, and both change the mounting design.
FIG. 2 A general purpose farm building, drawn
48 m phase 1
Drawing Typical general purpose building
Roof 48 x 24 m
Array 130 kWp
Yield 117,000 kWh/yr
Scale 1:250 / Rev A

Illustrative layout for a unit of this size. Your own figures come from the roof survey.

Rooflight sheets and edge setbacks stay clear, so the array stops short of the gross roof area. Phase one is the block a first quotation usually prices. Illustrative of a typical building rather than a specific one.
FIG. 3 Gross roof to usable array
gross roof 1,600 m²
usable 1,150 m²
rooflightsplant and ductswalkways, setbacks usable roof
1,150 m² ÷ 2.2 m² per kWp = 523 kWp
On an agricultural building the deductions are rooflight sheets, ridge and gable ventilation, and the setbacks a safe working edge needs. Proportions are illustrative. Yours are measured on the day.

The survey we run before anyone quotes

A farm solar survey is a structural, electrical and commercial assessment that establishes what your buildings can physically carry and what the resulting system would be worth. It is free, it carries no obligation, and the report is yours whoever ends up doing the work. It is also the only honest way to size an on-site energy scheme.

ITEM
WHAT WE MEASURE
WHY IT DECIDES THE SCHEME
OUTPUT
A
Structure and covering
Roof pitch, purlin type and centres, sheet condition and remaining life, and the additional dead load a timber or cold rolled frame will take. Asbestos cement is identified, not avoided.
loading statement
B
Usable roof area
Rooflight sheets, ridge vents, and shading from trees, silos and grain bins come out of the gross area first. What is left sets the array size in kWp, which is the only figure worth quoting against.
array layout, kWp
C
Your load profile
Half hourly energy consumption against modelled generation, so the split between what the holding uses on site and what it exports is measured rather than assumed. Seasonal loads are read across a full year.
self-consumption share
D
The connection
The network operator for your area, whether the supply is single or three phase, the export limit worth applying for, and whether the connection runs under G98 or G99.
G99 application

Asbestos is identified rather than worked around. Where a fibre cement roof is near the end of its life, re-sheeting first is usually cheaper than lifting an array off in five years to do it then, and the sequence is worth settling before a quotation is written rather than after.

We also ask what else is planned. A new building, a change of enterprise, a grain drier upgrade on an arable unit or a move to robotic milking on a dairy all shift the energy demand, and a system meant to last twenty years should be sized against the electricity the farm will use in ten years rather than the electricity it used last year. The survey records your own requirements alongside what the buildings can take.

886
kWh per kWp a year, the mean across the towns we cover
324
kWh per kWp between the sunniest of them and the dullest
383
ground mounted solar schemes recorded across those towns
48
counties we arrange farm surveys in
Yield modelled with EU PVGIS v5.2, SARAH3. Ground mounted scheme counts from the Renewable Energy Planning Database, Q1 2026.

How much energy a farm roof produces in a year

Annual generation is the product of the system size in kWp and the energy yield for your location, expressed in kWh of electricity for every kWp installed. Across the towns on this site, modelled yield runs from 704 to 1,028 kWh per kWp a year (EU PVGIS v5.2, SARAH3), and every location page carries the figure for that area alongside its source, so the generation potential of a roof in Cornwall and one in Aberdeenshire are not treated as the same number.

Value follows consumption rather than generation. Electricity used on site displaces the day rate you would otherwise pay for energy, which is the highest value outcome available to farms. Electricity exported earns the Smart Export Guarantee rate from your chosen supplier (Ofgem), which is materially lower. That split is the largest single lever on payback and it is measurable from your existing energy data rather than assumed.

Farm loads make the split unusually interesting. An arable holding that dries grain through September and does very little in February has a generation curve and an energy demand curve that barely overlap, while a poultry unit or a cold store matches the roof almost hour for hour. Poultry buildings in particular run ventilation through the brightest hours of the year, which is why poultry is the enterprise that most often returns a strong result on the first pass. We model twelve months of consumption rather than an annual total, because the annual total hides exactly the thing that decides the return.

SOURCE
EU PVGIS v5.2, SARAH3, 10 degree pitch, 14 percent system loss
FIG. 4 Modelled yield across the towns we cover

Modelled yield across the towns we cover

One dot per town, positioned at its centroid and shaded by modelled annual yield in kWh per kWp. Source: EU PVGIS v5.2.

Bedford, Bedfordshire: 281.72334465980407 kWh per kWp Biggleswade, Bedfordshire: 285.3409263675715 kWh per kWp Dunstable, Bedfordshire: 298.3553435266099 kWh per kWp Flitwick, Bedfordshire: 290.5307104240969 kWh per kWp Leighton Buzzard, Bedfordshire: 296.0533805771428 kWh per kWp Luton, Bedfordshire: 297.7679106321917 kWh per kWp Sandy, Bedfordshire: 281.8958040923946 kWh per kWp Bracknell, Berkshire: 329.6218809775845 kWh per kWp Maidenhead, Berkshire: 322.42701785852233 kWh per kWp Newbury, Berkshire: 329.9398698617491 kWh per kWp Reading, Berkshire: 327.4404307785992 kWh per kWp Slough, Berkshire: 322.4493813452235 kWh per kWp Thatcham, Berkshire: 330.24747959955357 kWh per kWp Windsor, Berkshire: 325.21811635977656 kWh per kWp Wokingham, Berkshire: 330.4949362934402 kWh per kWp Bedminster, Bristol: 327.526148680776 kWh per kWp Bishopston, Bristol: 325.2466035329177 kWh per kWp Filton, Bristol: 322.67771871150813 kWh per kWp Hengrove, Bristol: 329.0454173718022 kWh per kWp Keynsham, Bristol: 329.45506225383747 kWh per kWp Amersham, Buckinghamshire: 311.97171042411674 kWh per kWp Aylesbury, Buckinghamshire: 303.18305160832267 kWh per kWp Beaconsfield, Buckinghamshire: 316.58140689706977 kWh per kWp Buckingham, Buckinghamshire: 291.0487205836627 kWh per kWp Chesham, Buckinghamshire: 309.47932155185407 kWh per kWp High Wycombe, Buckinghamshire: 315.12525561427674 kWh per kWp Marlow, Buckinghamshire: 318.80087762323967 kWh per kWp Princes Risborough, Buckinghamshire: 308.9135719639022 kWh per kWp Cambridge, Cambridgeshire: 277.4859938171247 kWh per kWp Ely, Cambridgeshire: 264.67530702621286 kWh per kWp Huntingdon, Cambridgeshire: 268.61845480932357 kWh per kWp March, Cambridgeshire: 254.54370267985078 kWh per kWp Peterborough, Cambridgeshire: 253.4592448007855 kWh per kWp St Ives, Cambridgeshire: 268.9988050823523 kWh per kWp St Neots, Cambridgeshire: 276.1946632449203 kWh per kWp Wisbech, Cambridgeshire: 247.15376402775388 kWh per kWp Canton, Cardiff: 324.79125056122234 kWh per kWp Cathays, Cardiff: 323.88933900868034 kWh per kWp Pontcanna, Cardiff: 324.13456925734107 kWh per kWp Splott, Cardiff: 324.62982428128953 kWh per kWp Chester, Cheshire: 212.7899805183396 kWh per kWp Crewe, Cheshire: 219.1663146489294 kWh per kWp Ellesmere Port, Cheshire: 207.22504334060542 kWh per kWp Macclesfield, Cheshire: 208.2031139991811 kWh per kWp Nantwich, Cheshire: 221.02229780971317 kWh per kWp Northwich, Cheshire: 208.27826364922106 kWh per kWp Warrington, Cheshire: 199.7911747458582 kWh per kWp Wilmslow, Cheshire: 203.9195575096511 kWh per kWp Bodmin, Cornwall: 391.2855797754894 kWh per kWp Bude, Cornwall: 367.44813743031926 kWh per kWp Camborne, Cornwall: 407.8269305718234 kWh per kWp Falmouth, Cornwall: 412.05999604141897 kWh per kWp Newquay, Cornwall: 394.8500765323905 kWh per kWp Penzance, Cornwall: 414 kWh per kWp St Austell, Cornwall: 399.3919678802231 kWh per kWp Truro, Cornwall: 404.6394935621856 kWh per kWp Bishop Auckland, County Durham: 117.19130208712903 kWh per kWp Chester-le-Street, County Durham: 103.69779998266807 kWh per kWp Consett, County Durham: 104.0575560349443 kWh per kWp Durham, County Durham: 108.46424180318314 kWh per kWp Newton Aycliffe, County Durham: 119.18274560575901 kWh per kWp Peterlee, County Durham: 110.00570815915529 kWh per kWp Barrow-in-Furness, Cumbria: 152.14640665555083 kWh per kWp Carlisle, Cumbria: 101.29642025270778 kWh per kWp Kendal, Cumbria: 138.35843723332266 kWh per kWp Penrith, Cumbria: 116.20663408605998 kWh per kWp Whitehaven, Cumbria: 124.43248545575358 kWh per kWp Workington, Cumbria: 117.86987083359651 kWh per kWp Belper, Derbyshire: 223.66187499733329 kWh per kWp Buxton, Derbyshire: 208.68637596924765 kWh per kWp Chesterfield, Derbyshire: 209.54326311607574 kWh per kWp Derby, Derbyshire: 231.06119525267448 kWh per kWp Ilkeston, Derbyshire: 227.65170304359424 kWh per kWp Long Eaton, Derbyshire: 232.39815430142744 kWh per kWp Matlock, Derbyshire: 215.99974419275296 kWh per kWp Swadlincote, Derbyshire: 240.02107545370723 kWh per kWp Barnstaple, Devon: 351.3164495987953 kWh per kWp Exeter, Devon: 374.89764556685134 kWh per kWp Exmouth, Devon: 380.82658300630595 kWh per kWp Newton Abbot, Devon: 387.36183339767854 kWh per kWp Paignton, Devon: 393.98953471222836 kWh per kWp Plymouth, Devon: 395.9285329919472 kWh per kWp Tiverton, Devon: 362.7082152062282 kWh per kWp Torquay, Devon: 389.90311932564623 kWh per kWp Bournemouth, Dorset: 373.3593909856212 kWh per kWp Bridport, Dorset: 373.899697102132 kWh per kWp Christchurch, Dorset: 373.32097017268205 kWh per kWp Dorchester, Dorset: 375.4109383101114 kWh per kWp Poole, Dorset: 374.35380636593277 kWh per kWp Sherborne, Dorset: 359.6701573945961 kWh per kWp Weymouth, Dorset: 380.4673886051333 kWh per kWp Wimborne, Dorset: 369.5228660854038 kWh per kWp Beverley, East Riding of Yorkshire: 170.07767345248703 kWh per kWp Bridlington, East Riding of Yorkshire: 153.92101251436628 kWh per kWp Driffield, East Riding of Yorkshire: 159.37944487234955 kWh per kWp Goole, East Riding of Yorkshire: 179.12935783394514 kWh per kWp Hessle, East Riding of Yorkshire: 177.81731298440695 kWh per kWp Hull, East Riding of Yorkshire: 169.02788721036106 kWh per kWp Basildon, Essex: 318.94882903809093 kWh per kWp Braintree, Essex: 298.5471695944073 kWh per kWp Brentwood, Essex: 315.4227240220799 kWh per kWp Canvey Island, Essex: 322.23440699194344 kWh per kWp Chelmsford, Essex: 307.93241936617244 kWh per kWp Clacton-on-Sea, Essex: 303.9922132249902 kWh per kWp Colchester, Essex: 297.8999921538792 kWh per kWp Grays, Essex: 324.6860637926025 kWh per kWp Harlow, Essex: 306.04456141706964 kWh per kWp Southend-on-Sea, Essex: 319.9857943399012 kWh per kWp Cheltenham, Gloucestershire: 297.65668463601656 kWh per kWp Cirencester, Gloucestershire: 309.8168941658977 kWh per kWp Gloucester, Gloucestershire: 300.3632147908673 kWh per kWp Lydney, Gloucestershire: 308.78138337582595 kWh per kWp Stroud, Gloucestershire: 307.68042533834034 kWh per kWp Tewkesbury, Gloucestershire: 291.50182961112546 kWh per kWp Barking, Greater London: 321.11314919166307 kWh per kWp Barnet, Greater London: 313.80585791414603 kWh per kWp Battersea, Greater London: 325.57072847392715 kWh per kWp Bermondsey, Greater London: 323.942470605122 kWh per kWp Bexley, Greater London: 327.43675147700475 kWh per kWp Brixton, Greater London: 326.1678331225875 kWh per kWp Bromley, Greater London: 329.9215732497622 kWh per kWp Camden, Greater London: 321.0574776829163 kWh per kWp Chelsea, Greater London: 324.4140389383567 kWh per kWp City of London, Greater London: 322.6726995007895 kWh per kWp Clapham, Greater London: 326.03266334080126 kWh per kWp Croydon, Greater London: 331.89502792454323 kWh per kWp Ealing, Greater London: 322.71056297479674 kWh per kWp Enfield, Greater London: 313.63910639133036 kWh per kWp Fulham, Greater London: 325.47389841476354 kWh per kWp Hackney, Greater London: 320.68172360060794 kWh per kWp Hammersmith, Greater London: 324.08616861488724 kWh per kWp Hampstead, Greater London: 319.9009730724419 kWh per kWp Harrow, Greater London: 318.97670024936866 kWh per kWp Havering, Greater London: 316.01398286565546 kWh per kWp Highgate, Greater London: 318.51655192239394 kWh per kWp Hillingdon, Greater London: 320.276237026494 kWh per kWp Hounslow, Greater London: 325.73108327719046 kWh per kWp Ilford, Greater London: 319.8392380933228 kWh per kWp Islington, Greater London: 321.1540280846121 kWh per kWp Kensington, Greater London: 323.57682991876436 kWh per kWp Kentish Town, Greater London: 320.2807477122545 kWh per kWp Kingston, Greater London: 368.88675245959007 kWh per kWp Lewisham, Greater London: 326.4260037263507 kWh per kWp Leytonstone, Greater London: 319.0575284131703 kWh per kWp Marylebone, Greater London: 322.3743880214249 kWh per kWp Mayfair, Greater London: 322.98274792780387 kWh per kWp Merton, Greater London: 329.25668221619674 kWh per kWp Notting Hill, Greater London: 322.776390495003 kWh per kWp Redbridge, Greater London: 318.53221118889667 kWh per kWp Richmond, Greater London: 326.2623031583996 kWh per kWp Shoreditch, Greater London: 321.99744332889986 kWh per kWp Southwark, Greater London: 323.43395467059867 kWh per kWp Stratford, Greater London: 320.97500146683325 kWh per kWp Sutton, Greater London: 238.70114401047582 kWh per kWp Tottenham, Greater London: 317.8077010005661 kWh per kWp Tower Hamlets, Greater London: 348.00177010572236 kWh per kWp Vauxhall, Greater London: 324.360970575181 kWh per kWp Walthamstow, Greater London: 317.60868437765856 kWh per kWp Wandsworth, Greater London: 326.44714619683333 kWh per kWp Wembley, Greater London: 320.095479597054 kWh per kWp Westminster, Greater London: 323.5497460230426 kWh per kWp Whitechapel, Greater London: 322.5419912449539 kWh per kWp Wimbledon, Greater London: 328.8380288573417 kWh per kWp Woolwich, Greater London: 324.239201739759 kWh per kWp Altrincham, Greater Manchester: 199.48563505238235 kWh per kWp Ashton-under-Lyne, Greater Manchester: 192.8461016472297 kWh per kWp Bolton, Greater Manchester: 186.70451162804687 kWh per kWp Bury, Greater Manchester: 186.33513099541796 kWh per kWp Manchester, Greater Manchester: 194.20739163859804 kWh per kWp Oldham, Greater Manchester: 189.9084498209938 kWh per kWp Rochdale, Greater Manchester: 185.04195350491062 kWh per kWp Salford, Greater Manchester: 193.085909375144 kWh per kWp Stockport, Greater Manchester: 198.41686038493273 kWh per kWp Wigan, Greater Manchester: 189.4979296242628 kWh per kWp Bangor, Gwynedd: 210.3793247657804 kWh per kWp Bethesda, Gwynedd: 213.5561061813508 kWh per kWp Caernarfon, Gwynedd: 216.0936686475548 kWh per kWp Dolgellau, Gwynedd: 242.15653863391375 kWh per kWp Porthmadog, Gwynedd: 230.13571537126867 kWh per kWp Pwllheli, Gwynedd: 232.526834338167 kWh per kWp Aldershot, Hampshire: 340.08545283600836 kWh per kWp Andover, Hampshire: 342.40524891586995 kWh per kWp Basingstoke, Hampshire: 338.96343492669484 kWh per kWp Eastleigh, Hampshire: 358.2060871064827 kWh per kWp Fareham, Hampshire: 366.13312743708474 kWh per kWp Farnborough, Hampshire: 337.6815636942091 kWh per kWp Fleet, Hampshire: 338.2983454481741 kWh per kWp Portsmouth, Hampshire: 367.95314294884395 kWh per kWp Southampton, Hampshire: 361.51975181502246 kWh per kWp Winchester, Hampshire: 352.2611346922998 kWh per kWp Bishop's Stortford, Hertfordshire: 299.4254407118948 kWh per kWp Borehamwood, Hertfordshire: 313.15096298577856 kWh per kWp Harpenden, Hertfordshire: 302.9725652841394 kWh per kWp Hatfield, Hertfordshire: 306.2828765595275 kWh per kWp Hemel Hempstead, Hertfordshire: 307.1392030953598 kWh per kWp Hertford, Hertfordshire: 304.13491013919986 kWh per kWp St Albans, Hertfordshire: 306.97034130988567 kWh per kWp Stevenage, Hertfordshire: 296.7758527536263 kWh per kWp Watford, Hertfordshire: 313.92433948092406 kWh per kWp Welwyn Garden City, Hertfordshire: 303.79524184598654 kWh per kWp Ashford, Kent: 346.652403895995 kWh per kWp Canterbury, Kent: 338.1233436268558 kWh per kWp Chatham, Kent: 332.6882553230986 kWh per kWp Dartford, Kent: 327.15413244880915 kWh per kWp Dover, Kent: 348.0076977023831 kWh per kWp Folkestone, Kent: 350.75945484437847 kWh per kWp Gravesend, Kent: 328.2976134069984 kWh per kWp Maidstone, Kent: 338.6720722657527 kWh per kWp Margate, Kent: 331.7940525773709 kWh per kWp Sevenoaks, Kent: 338.1358573574249 kWh per kWp Tonbridge, Kent: 343.54655510681073 kWh per kWp Tunbridge Wells, Kent: 347.64283797118594 kWh per kWp Accrington, Lancashire: 176.18306312437014 kWh per kWp Blackburn, Lancashire: 176.39555741998748 kWh per kWp Blackpool, Lancashire: 173.10515360586416 kWh per kWp Burnley, Lancashire: 173.30505750590245 kWh per kWp Chorley, Lancashire: 182.53476125451863 kWh per kWp Lancaster, Lancashire: 156.39163248966656 kWh per kWp Lytham St Anne's, Lancashire: 176.12223685469024 kWh per kWp Preston, Lancashire: 174.7695544885736 kWh per kWp Coalville, Leicestershire: 243.2893332751098 kWh per kWp Hinckley, Leicestershire: 255.4000329180828 kWh per kWp Leicester, Leicestershire: 249.42056403880164 kWh per kWp Loughborough, Leicestershire: 240.54714992942334 kWh per kWp Market Harborough, Leicestershire: 259.5274404068642 kWh per kWp Melton Mowbray, Leicestershire: 240.3897190523726 kWh per kWp Wigston, Leicestershire: 252.50390976198938 kWh per kWp Boston, Lincolnshire: 227.0254570804492 kWh per kWp Gainsborough, Lincolnshire: 199.19641418082387 kWh per kWp Grantham, Lincolnshire: 231.1764337024945 kWh per kWp Lincoln, Lincolnshire: 211.48370276958562 kWh per kWp Skegness, Lincolnshire: 215.96202486115533 kWh per kWp Sleaford, Lincolnshire: 225.33868533605602 kWh per kWp Spalding, Lincolnshire: 239.7657694627967 kWh per kWp Stamford, Lincolnshire: 247.8040439929475 kWh per kWp Birkenhead, Merseyside: 200.10439745373375 kWh per kWp Bootle, Merseyside: 195.401809859435 kWh per kWp Liverpool, Merseyside: 198.41320643220627 kWh per kWp Southport, Merseyside: 183.66743125190808 kWh per kWp St Helens, Merseyside: 195.95673713340386 kWh per kWp Wallasey, Merseyside: 197.97980492123384 kWh per kWp Caerleon, Newport: 316.40105164803805 kWh per kWp Cwmbrân, Newport: 313.8635396428425 kWh per kWp Maindee, Newport: 317.7578773892046 kWh per kWp Pontypool, Newport: 311.0866703890989 kWh per kWp Attleborough, Norfolk: 257.2344736695861 kWh per kWp Cromer, Norfolk: 229.8226522365927 kWh per kWp Dereham, Norfolk: 246.5054937302208 kWh per kWp Great Yarmouth, Norfolk: 251.54542082361093 kWh per kWp King's Lynn, Norfolk: 240.95357031100335 kWh per kWp Norwich, Norfolk: 248.77664553968825 kWh per kWp Thetford, Norfolk: 263.72883234416395 kWh per kWp Wymondham, Norfolk: 253.38289626707228 kWh per kWp Harrogate, North Yorkshire: 160.39185285507844 kWh per kWp Knaresborough, North Yorkshire: 159.23307727772954 kWh per kWp Northallerton, North Yorkshire: 137.25880632288363 kWh per kWp Ripon, North Yorkshire: 150.51995895003319 kWh per kWp Scarborough, North Yorkshire: 142.90778934194304 kWh per kWp Skipton, North Yorkshire: 162.49928437291112 kWh per kWp Whitby, North Yorkshire: 128.41035308505786 kWh per kWp York, North Yorkshire: 162.588309175964 kWh per kWp Corby, Northamptonshire: 258.65741882229673 kWh per kWp Daventry, Northamptonshire: 273.6109873286177 kWh per kWp Kettering, Northamptonshire: 264.7475784152707 kWh per kWp Northampton, Northamptonshire: 275.24352251885813 kWh per kWp Rushden, Northamptonshire: 271.88831151302566 kWh per kWp Towcester, Northamptonshire: 282.4202997465492 kWh per kWp Wellingborough, Northamptonshire: 270.8559370280745 kWh per kWp Alnwick, Northumberland: 67.28080596193053 kWh per kWp Berwick-upon-Tweed, Northumberland: 44.22312201075175 kWh per kWp Blyth, Northumberland: 86.31699892062176 kWh per kWp Cramlington, Northumberland: 88.50393421597448 kWh per kWp Hexham, Northumberland: 96.19514518431635 kWh per kWp Morpeth, Northumberland: 83.38586596051175 kWh per kWp Arnold, Nottinghamshire: 225.3063454556425 kWh per kWp Mansfield, Nottinghamshire: 216.12234160865847 kWh per kWp Newark, Nottinghamshire: 220.34893086083574 kWh per kWp Nottingham, Nottinghamshire: 227.49717172119765 kWh per kWp Retford, Nottinghamshire: 204.17015213339315 kWh per kWp West Bridgford, Nottinghamshire: 230.15933878893978 kWh per kWp Worksop, Nottinghamshire: 204.9524438612631 kWh per kWp Abingdon, Oxfordshire: 312.46502221003743 kWh per kWp Banbury, Oxfordshire: 286.76730036248966 kWh per kWp Bicester, Oxfordshire: 297.45714666314626 kWh per kWp Didcot, Oxfordshire: 316.33044664868123 kWh per kWp Henley-on-Thames, Oxfordshire: 321.49192464839376 kWh per kWp Oxford, Oxfordshire: 306.8160550119271 kWh per kWp Thame, Oxfordshire: 307.4402263135383 kWh per kWp Witney, Oxfordshire: 304.77812513828746 kWh per kWp Brecon, Powys: 294.2811795112867 kWh per kWp Builth Wells, Powys: 281.0774218921908 kWh per kWp Hay on Wye, Powys: 285.9800098859165 kWh per kWp Llandrindod Wells, Powys: 275.040614956441 kWh per kWp Newtown, Powys: 257.52351723020456 kWh per kWp Welshpool, Powys: 247.55667596255998 kWh per kWp Bridgnorth, Shropshire: 255.74007333611328 kWh per kWp Ludlow, Shropshire: 266.61290629022915 kWh per kWp Market Drayton, Shropshire: 231.43655985994567 kWh per kWp Oswestry, Shropshire: 234.7434475736776 kWh per kWp Shrewsbury, Shropshire: 244.2425958471739 kWh per kWp Bath, Somerset: 331.37449975550595 kWh per kWp Bridgwater, Somerset: 348.22528088608806 kWh per kWp Frome, Somerset: 341.21700331816743 kWh per kWp Glastonbury, Somerset: 346.7179396186683 kWh per kWp Taunton, Somerset: 355.1703654921837 kWh per kWp Wells, Somerset: 342.6469940847311 kWh per kWp Weston-super-Mare, Somerset: 333.81772190273585 kWh per kWp Yeovil, Somerset: 360.21138973805455 kWh per kWp Barnsley, South Yorkshire: 188.6409596889813 kWh per kWp Doncaster, South Yorkshire: 191.60864294726585 kWh per kWp Mexborough, South Yorkshire: 192.70440716591165 kWh per kWp Rotherham, South Yorkshire: 197.1173063397771 kWh per kWp Sheffield, South Yorkshire: 200.81662597590594 kWh per kWp Wombwell, South Yorkshire: 191.07110453781414 kWh per kWp Burton upon Trent, Staffordshire: 238.28412256726932 kWh per kWp Cannock, Staffordshire: 245.0705866793623 kWh per kWp Lichfield, Staffordshire: 246.1340684210264 kWh per kWp Newcastle-under-Lyme, Staffordshire: 223.89382911437343 kWh per kWp Stafford, Staffordshire: 238.3835989914075 kWh per kWp Stoke-on-Trent, Staffordshire: 226.07151292477656 kWh per kWp Tamworth, Staffordshire: 249.95504113952896 kWh per kWp Bury St Edmunds, Suffolk: 274.68424976663186 kWh per kWp Felixstowe, Suffolk: 293.46123701757165 kWh per kWp Ipswich, Suffolk: 287.1442653622099 kWh per kWp Leiston, Suffolk: 277.22395903278095 kWh per kWp Lowestoft, Suffolk: 259.8951333277485 kWh per kWp Newmarket, Suffolk: 274.58255489860005 kWh per kWp Stowmarket, Suffolk: 278.6872417700056 kWh per kWp Sudbury, Suffolk: 288.2754117178646 kWh per kWp Camberley, Surrey: 334.363228517413 kWh per kWp Dorking, Surrey: 341.3591579459071 kWh per kWp Epsom, Surrey: 334.61232918690337 kWh per kWp Farnham, Surrey: 342.69141709819274 kWh per kWp Guildford, Surrey: 340.3360332421085 kWh per kWp Leatherhead, Surrey: 337.57160638020986 kWh per kWp Redhill, Surrey: 341.30470913755494 kWh per kWp Staines, Surrey: 327.9517379189155 kWh per kWp Weybridge, Surrey: 331.82104380348403 kWh per kWp Woking, Surrey: 336.0836087319666 kWh per kWp Bognor Regis, Sussex: 369.956494044668 kWh per kWp Brighton, Sussex: 368.020343140096 kWh per kWp Chichester, Sussex: 366.8791627063281 kWh per kWp Crawley, Sussex: 348.7913056474977 kWh per kWp Eastbourne, Sussex: 370.01408978884643 kWh per kWp Hastings, Sussex: 364.6050667481878 kWh per kWp Haywards Heath, Sussex: 356.33268680375363 kWh per kWp Horsham, Sussex: 351.9321497897726 kWh per kWp Lewes, Sussex: 364.61304669335846 kWh per kWp Worthing, Sussex: 367.58868523454436 kWh per kWp Morriston, Swansea: 312.7693487205769 kWh per kWp Mumbles, Swansea: 318.6668142685116 kWh per kWp Neath, Swansea: 312.89682030667444 kWh per kWp Sketty, Swansea: 315.96489463181524 kWh per kWp Gateshead, Tyne and Wear: 98.17472128634614 kWh per kWp Newcastle, Tyne and Wear: 16.000000000000057 kWh per kWp North Shields, Tyne and Wear: 93.67286858272615 kWh per kWp South Shields, Tyne and Wear: 95.67789484472576 kWh per kWp Sunderland, Tyne and Wear: 100.55836858238087 kWh per kWp Washington, Tyne and Wear: 100.49121937165671 kWh per kWp Bedworth, Warwickshire: 259.840522243107 kWh per kWp Kenilworth, Warwickshire: 268.21265391781446 kWh per kWp Leamington Spa, Warwickshire: 271.7164769644894 kWh per kWp Nuneaton, Warwickshire: 256.4555066728842 kWh per kWp Rugby, Warwickshire: 266.18202860916034 kWh per kWp Stratford-upon-Avon, Warwickshire: 278.2183856348082 kWh per kWp Warwick, Warwickshire: 272.61575365605506 kWh per kWp Birmingham, West Midlands: 259.3615610597348 kWh per kWp Coventry, West Midlands: 264.03875800281077 kWh per kWp Dudley, West Midlands: 257.77317738793636 kWh per kWp Solihull, West Midlands: 264.07351313322704 kWh per kWp Sutton Coldfield, West Midlands: 253.94795004390335 kWh per kWp Walsall, West Midlands: 252.947914288372 kWh per kWp West Bromwich, West Midlands: 256.11722031619433 kWh per kWp Wolverhampton, West Midlands: 252.32128999568954 kWh per kWp Bradford, West Yorkshire: 173.36688972313542 kWh per kWp Dewsbury, West Yorkshire: 180.43825208901373 kWh per kWp Halifax, West Yorkshire: 177.60347512319473 kWh per kWp Huddersfield, West Yorkshire: 182.89336293050934 kWh per kWp Ilkley, West Yorkshire: 164.5824365009824 kWh per kWp Leeds, West Yorkshire: 172.4539696014329 kWh per kWp Pontefract, West Yorkshire: 179.9640605043456 kWh per kWp Wakefield, West Yorkshire: 180.49453195466546 kWh per kWp Chippenham, Wiltshire: 326.33754840386763 kWh per kWp Devizes, Wiltshire: 333.39282852064696 kWh per kWp Marlborough, Wiltshire: 328.7604545799311 kWh per kWp Melksham, Wiltshire: 331.7264161217772 kWh per kWp Salisbury, Wiltshire: 351.4837510285768 kWh per kWp Swindon, Wiltshire: 319.0995396023935 kWh per kWp Trowbridge, Wiltshire: 335.06674065365644 kWh per kWp Warminster, Wiltshire: 343.01796934481405 kWh per kWp Bromsgrove, Worcestershire: 269.16582378082296 kWh per kWp Droitwich, Worcestershire: 273.28046814036156 kWh per kWp Evesham, Worcestershire: 285.22032870819567 kWh per kWp Kidderminster, Worcestershire: 265.46373024378534 kWh per kWp Malvern, Worcestershire: 282.65145594055366 kWh per kWp Redditch, Worcestershire: 271.34734180827957 kWh per kWp Worcester, Worcestershire: 277.93722339081916 kWh per kWp
kWh per kWp a year
  • 704
  • 758
  • 812
  • 866
  • 920
  • 974

The spread between the best and worst town on this map is 324 kWh per kWp, which is about 46 percent. On a 500 kWp array that is roughly 162,000 kWh a year of difference for the same money spent.

Source: EU PVGIS v5.2

Renting land to a solar developer against generating for yourself

Renting land to a solar developer is a property transaction that pays an option fee and then rental income under a long lease, and it is a different proposition from putting panels on your own roof to cut your own energy bills. Both are worth considering, they answer different questions, and a farm business can sensibly do one, the other or neither, depending on where its energy costs actually sit.

A solar farm on your land is somebody else's asset. The developer funds the scheme, builds it, operates it and sells the electricity, and you receive income for a term usually measured in decades with that arable land out of production throughout. The Renewable Energy Planning Database records 383 ground mounted solar schemes across the towns this site covers in the United Kingdom (REPD, Q1 2026), so the pattern is well established, and the binding constraint on a solar farm is almost always the grid connection rather than the land itself.

A rooftop array is your asset. You fund it or finance it, the farm consumes most of the energy it makes, and the return is the electricity you no longer buy rather than a rent cheque. It uses no land, needs no change of use, and is a far smaller project to get through. Most farms we speak to have more roof than they realised and less spare electricity capacity than they hoped. Our short guide to the leasing route sets out what an option agreement actually commits you to, including the effect on tenancy, lending and succession.

We do not publish a rent per acre, because any figure quoted without knowing your grid position, your land grade and your distance to a connection point is a guess dressed up as advice. Diversification income from a solar farm is real, and so is the case for keeping the land, banking the income you already have and using the barn roofs for your own energy instead. We will say honestly which of the two routes a farm is actually suited to.

SOURCE
383
ground mount schemes in the REPD across our towns, Q1 2026
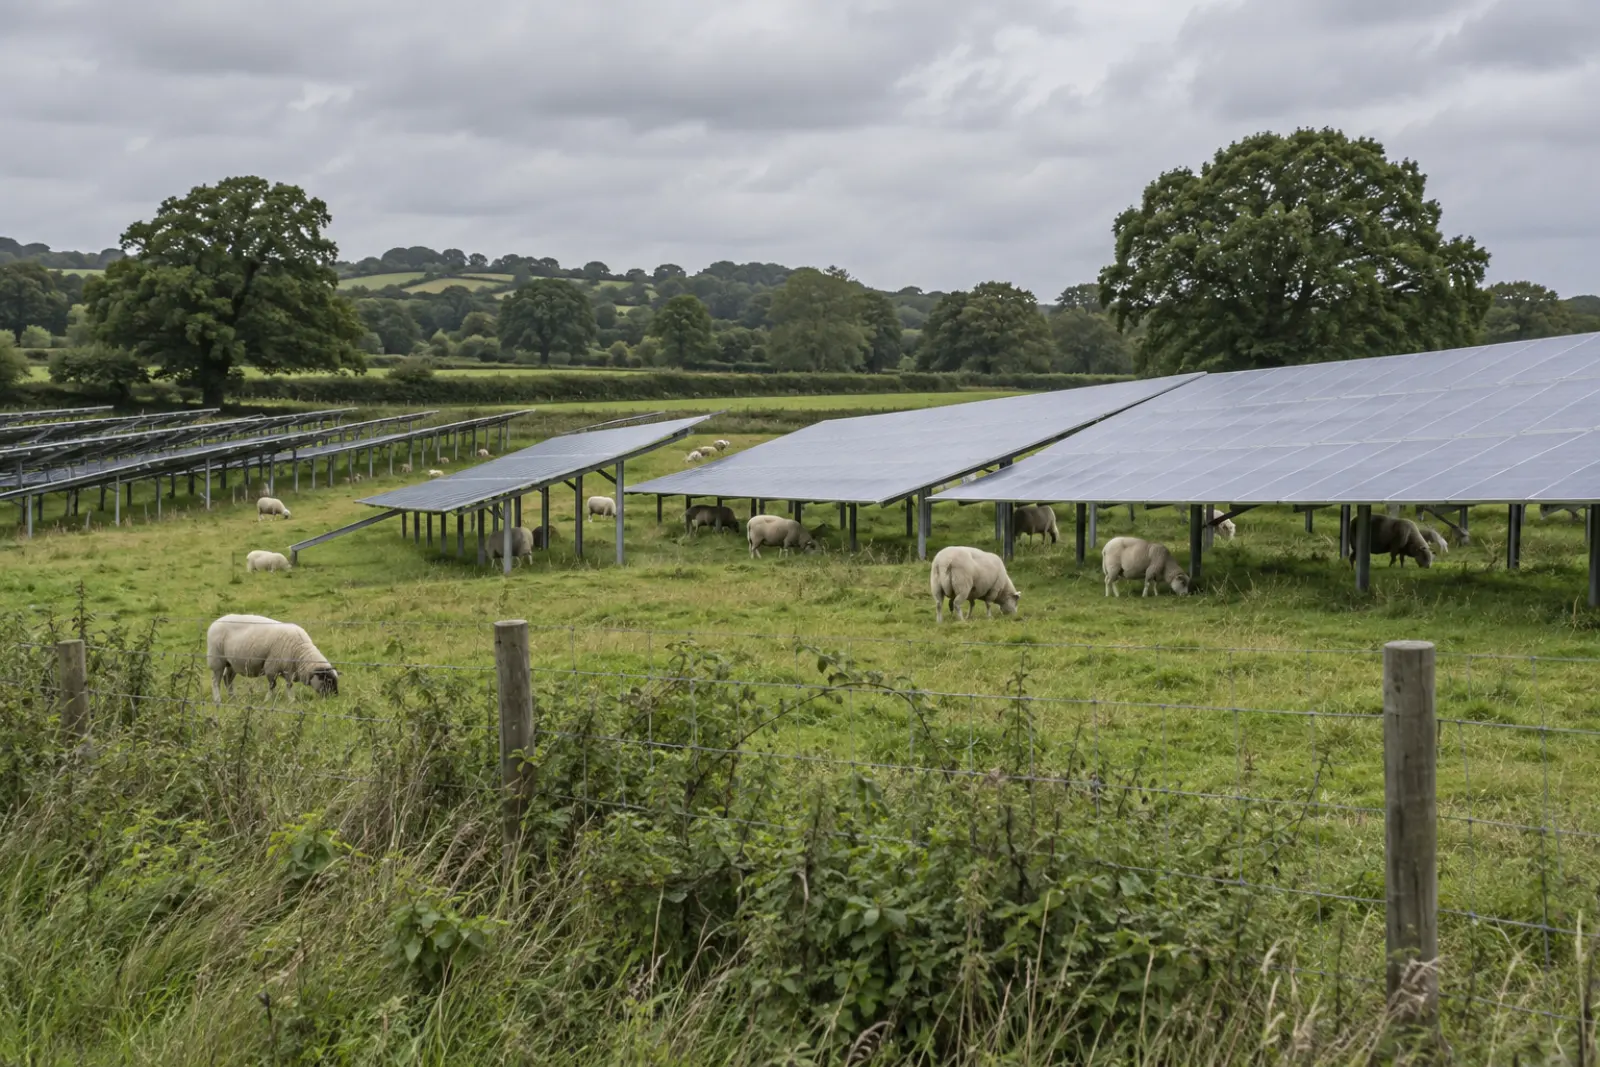
Rows of ground mounted solar panels on a sloping field, with sheep grazing between and beneath the rows
Rows of ground mounted panels on a sloping field with sheep grazing beneath them. The land stays in agricultural use for the term of the lease, which is the point most option agreements turn on.

Planning permission for solar panels on farms

Planning permission for solar panels on farms turns on whether the array sits on a roof or on the ground, because the two fall under different parts of the planning system and attract completely different levels of scrutiny.

Roof mounted solar on an agricultural building in England is usually permitted development under Schedule 2, Part 14 of the Town and Country Planning (General Permitted Development) (England) Order 2015, subject to the limits and conditions that order sets out, including how far panels may project above the roof plane and prior approval in certain cases. Listed buildings, conservation areas, National Parks and National Landscapes change the answer, and Scotland, Wales and Northern Ireland have their own orders and their own requirements.

Ground mounted work is a different matter. Anything beyond a very small array needs a full planning application to the local planning authority, and schemes above 50 MW in England are determined by the Secretary of State as nationally significant infrastructure. Land quality carries weight too, because national planning policy asks decision makers to prefer poorer quality land over the best and most versatile agricultural grades. The local community is usually consulted, and on ground mounted schemes that consultation is where most objections arrive, whatever the energy case for the scheme.

We confirm the planning position with the local planning authority for your farm before the design is fixed rather than after. Where prior approval or a full application turns out to be needed, the survey pack already contains the drawings a planning case asks for, which is most of the reason it exists.

SOURCE
GPDO 2015
Schedule 2, Part 14, as amended
WATCH FOR
Listed buildings, National Parks and National Landscapes

Grid connection and three phase supply on a rural holding

A grid connection on a rural holding is frequently the constraint that decides the size of a farm solar system, and it is the item we look at earliest rather than last.

Many farms sit at the end of a long rural spur on a single phase supply, or on a three phase supply with very little headroom left in it. Generation up to 16 A per phase connects under G98 by notification. Anything larger needs a G99 application to your distribution network operator, who assesses the local network against its own connection requirements and sets an export limit, and on a weak rural line that limit can come back well below the energy the roof could comfortably produce.

None of that is fatal to the project. An export limited system still displaces all the on-site energy the farm uses, and export limitation is a setting in the inverter rather than a smaller array. What it does change is the arithmetic, because a scheme sized for export and then capped is a scheme sized wrong. We ask the network question before the design, and where a supply upgrade is the honest answer we say what it involves and roughly how long it takes.

ROUTE
G98 / G99
notification below 16 A per phase, application above it
WATCH FOR
A single phase supply at the end of a long rural spur

When a farm should add battery storage

A battery is a storage system that holds generation the farm cannot use at the moment it is produced and releases it later. On farms, battery storage converts exported electricity into on-site electricity, which raises the value of every kWh of energy the solar panels make.

A BATTERY EARNS ITS PLACE WHEN
  • Milking, grain drying or ventilation runs before sunrise or long after dark
  • The export limit the network operator agreed is lower than the roof can produce
  • A rural supply fails often enough that milk cooling needs to ride through it
  • Telehandler, tractor or vehicle charging runs into the evening
IT ADDS COST WITHOUT SAVING WHEN
  • The holding already consumes nearly everything the roof makes in daylight
  • The load is a poultry or cold store profile that tracks generation hour for hour
  • The same capital would buy more roof area, which is almost always the better buy first

Farm loads make the case for storage more often than commercial ones do. Morning milking on a dairy starts before sunrise, evening ventilation in a poultry unit runs long after the array has stopped, and a holding sitting under a restrictive export limit has an obvious use for energy it is not permitted to send anywhere.

Storage carries other benefits as well, and on farms the list is longer than it is on a commercial site: holding cheap overnight energy, supporting a telehandler or tractor charger, and carrying a critical load such as milk cooling through a rural power cut, which is a common enough event on a long spur to be worth designing for. We size any battery against twelve months of real data rather than a rule of thumb.

What farm building solar PV costs, and how the payback works

The cost of a farm solar system is set by the array size, the roof it lands on and the grid work the connection needs, and the payback is the electricity you stop buying, valued at the energy price you would otherwise have paid for it, set against that cost. There is no third element, whatever a rate card implies.

Price for every kWp falls as the array grows, because access, design, the grid application and commissioning are largely fixed costs spread across more solar panels. Roof condition is the variable that moves a farm quote most: a sound steel sheeted barn and a fibre cement roof needing re-sheeting are two different projects at the same kWp. We ask our partner to break a quotation into those lines so you can see which is which. We do not publish a price per kWp, because a figure given without seeing the building is a guess.

Tax relief is part of the arithmetic and it is regularly misunderstood on farms. HMRC treats a solar panel array as an integral feature, which places the expenditure in the special rate pool (HMRC Capital Allowances Manual, CA22335), though the Annual Investment Allowance will normally cover it instead. Full expensing is available to companies rather than to sole traders and partnerships, which is the distinction that matters when the farm business is a partnership. Your accountant confirms the position for your own business structure.

Grant funding moves around. Defra's Improving Farm Productivity grant and the Farming Equipment and Technology Fund have both opened and closed in rounds, and the eligible item lists change each time, so we point you at the current position on gov.uk rather than quoting an amount that may have lapsed. Our grants guide tracks where each one stands and what it has funded on farms, and our cost guide shows what the benefits look like set against your own quotation.

SOURCE
CA22335
HMRC Capital Allowances Manual, solar panels as integral features

Grazing, agrivoltaics and keeping land in production

Agrivoltaics is the practice of running agricultural production and solar generation on the same ground rather than choosing between them, and on UK solar farms it usually means grazing livestock between the rows.

Sheep graze under most British ground mounted arrays without difficulty. Table height and row spacing suit livestock of that size, the grass still needs managing, and the land stays in agriculture for the term of the lease. Cattle are the harder case, because they rub against posts and frames and need clearances a standard table does not offer, so schemes either fence livestock of that weight out and graze sheep instead, or the developer specifies raised and strengthened frames from the outset.

Other approaches exist and remain comparatively rare here: widely spaced or elevated rows over arable crops, and vertical bifacial fences along arable field boundaries that let machinery work between them. Margins and headlands under an array also support wildflower and pollinator planting, and those environmental benefits are the argument most planning cases lean on, alongside the community energy case where a scheme has local backing.

A rooftop array sidesteps the whole question, because the energy is generated over a yard that is already built on. That is the honest environmental case for looking at your barns before your fields.

IN PRACTICE
Sheep graze under most British ground mount arrays
WATCH FOR
Cattle, which rub and need clearances a standard table lacks

The installation process, from survey to commissioning

Installation is a fixed sequence that runs from survey through to commissioning, and on farms it is mostly paperwork, access and weather rather than panels.

FIG. 5 The sequence, and where it waits
01
survey
02
design and layout
03
G99 application
04
install
05
commission and certify
enquiry first generation

The connection is the long pole, which is why we submit it early rather than after a contract is signed. Anything above 3.68 kW per phase runs under G99, and the network operator sets the export limit.

Work starts with the survey and the design, then the grid application, because anything above 16 A per phase connects under G99 and the network operator sets the export limit. Then access, mounting, the modules themselves, the DC and AC electrical work and the tie in to your board. Then commissioning, testing of the solar panels and inverters, the MCS certificate and handover of the operation and maintenance file.

Time on the roof of a typical farm building is a matter of days rather than weeks. The connection is the long pole, which is why it goes in early. We plan around the farming calendar as well, because nobody wants scaffold against the grain store in September or a dairy parlour roof open during milking.

Maintenance afterwards is light: an annual inspection, a check on the inverters and clearing anything that has grown up to shade the array. An annual energy review is worth running alongside it, because a change of enterprise changes the electricity the buildings draw. Inverters carry the shortest working life in the system, so plan on replacing them once inside the solar array's life and treat that as a maintenance cost rather than a surprise. Two types of fault account for most call-outs on farms: soiling and shading, rather than anything wrong with the panels themselves.

Tell us about the buildings

Send the postcode and roughly what is in the yard. We come back with what the roofs can carry, what an array would generate against your own energy use, and what the funding routes look like on those numbers.

No survey fee, no obligation. Lenzie Consulting Ltd arranges the survey and passes your details to our MCS-certified installation partner so they can quote.

We pass your details to our MCS-certified installation partner so they can quote. Read the privacy notice.

Questions farmers ask before a survey

How much do farmers get paid for solar panels?
It depends which arrangement you mean, because the two pay in completely different ways. Farmers leasing land to a solar developer receive rental income under a long lease, negotiated case by case against the grid capacity available, the land grade and the distance to a connection point. A farmer putting solar panels on a farm building is not paid at all in the usual sense: the return is electricity no longer bought at the day rate, plus a smaller payment for exported units of energy under the Smart Export Guarantee (Ofgem). We do not publish rent figures, because a number quoted without knowing your grid position is a guess.
Can you put solar panels on farm land?
Yes, and ground mounted solar farms on agricultural land are well established in the UK. The Renewable Energy Planning Database records 383 ground mounted schemes across the towns this site covers (REPD, Q1 2026). What such a scheme needs is planning permission from the local planning authority, a viable grid connection and land the planning system is content to see used that way, since national policy asks decision makers to prefer poorer quality land over the best and most versatile agricultural grades. The land stays in agriculture on most schemes, with sheep grazing between the rows, and the arable ground either side carries on as before.
What is the 20 percent rule for solar panels?
The 20 percent rule is a phrase that circulates online rather than a rule in UK planning law, the building regulations or the grid codes. Nothing in any of them sets a 20 percent threshold for a farm array. What does constrain a farm solar system is the structural capacity of the building, the usable roof area once rooflight sheets, vents and shading come out, the export limit your network operator agrees under G98 or G99, and, for a ground mounted scheme, what the local planning authority will accept. People use the phrase for the share of a field a developer may build on and for the share of a barn roof an array may cover, and neither is a rule.
Can you graze cattle around solar panels?
Sheep are the usual answer, and they graze under the majority of British ground mounted arrays without difficulty. Cattle are harder. They rub against posts and frames, they can damage cabling, and they need clearances a standard table does not offer, so most schemes either fence cattle out of the array and graze lighter livestock instead, or the developer specifies raised and strengthened frames from the start. If cattle are your enterprise, raise it at the option stage rather than later, because it changes the design and therefore the cost.
Do you need planning permission for solar panels on agricultural buildings?
Roof mounted solar on an agricultural building in England usually falls under permitted development, within Schedule 2, Part 14 of the Town and Country Planning (General Permitted Development) (England) Order 2015 and subject to the limits and conditions it sets out, including projection above the roof plane and prior approval in certain cases. Listed buildings, conservation areas, National Parks and National Landscapes change the position, as do the separate orders in Scotland, Wales and Northern Ireland. We confirm it with the local planning authority for your farm before the design is finalised.
Are there grants for solar panels on farms?
Grant support for farm solar comes and goes in rounds rather than sitting open permanently. Defra's Improving Farm Productivity grant, under the Farming Investment Fund, has funded rooftop solar PV on farm buildings in England in past rounds, and the Farming Equipment and Technology Fund publishes an eligible item list that changes each time it opens (gov.uk). Scotland, Wales and Northern Ireland run their own renewable energy schemes on their own timetables. We check the current position rather than quoting amounts, because a figure from a closed round is worse than no figure at all. Our grants guide sets out what each scheme has covered.
Can solar panels go on an asbestos farm roof?
An asbestos cement roof can carry an array, but it is a decision to take deliberately rather than by default. Fibre cement sheet is a fragile surface under HSE guidance on fragile roofs, it cannot be walked on, and drilling or fixing into it is work regulated under the Control of Asbestos Regulations 2012, which also place a duty to manage on whoever controls the building. On an older barn the arithmetic often favours re-sheeting first, because the array then sits on a covering with a full service life ahead of it. We identify it on the survey and price the options.
How much money does 1 acre of solar panels make in the UK?
We do not publish a per acre figure, and it is worth treating anyone who does with some care. Income from land under a solar farm is negotiated scheme by scheme and turns on the grid capacity available at that point on the network, the land grade, the site's planning prospects and the length of the lease. Two neighbouring arable fields can be worth very different rents if one sits near spare capacity at a primary substation and the other does not. The honest first step is finding out what your grid position actually is.
Who installs the system, and what does your role cover?
Installation is carried out by our MCS-certified partner, who holds the contract with you and issues the certificate. We arrange the survey, the array design, the grid application, the funding comparison and the paperwork in between. The benefits of that split are worth stating plainly: you get a specialist arranging the work and a certified contractor carrying it out. We are not the installer, we do not hold MCS certification ourselves, and we say so plainly because the distinction matters when you are working out who is responsible for what.