Solar panels for farms in Rochdale
Most holdings around Rochdale already own the best generating site they will ever have, and it is the roof of the shed they built for something else. The survey starts on the covering: fibre cement or steel, its remaining life, the purlin spacing and what the frame will carry.
771 kWh per kWp a year at this latitude, so a 500 kWp array models at about 386,000 kWh. Source: EU PVGIS v5.2, SARAH3, 10 degree pitch, 14 percent system loss.
Book a roof survey in RochdaleIllustrative layout for a unit of this size. Your own figures come from the roof survey.
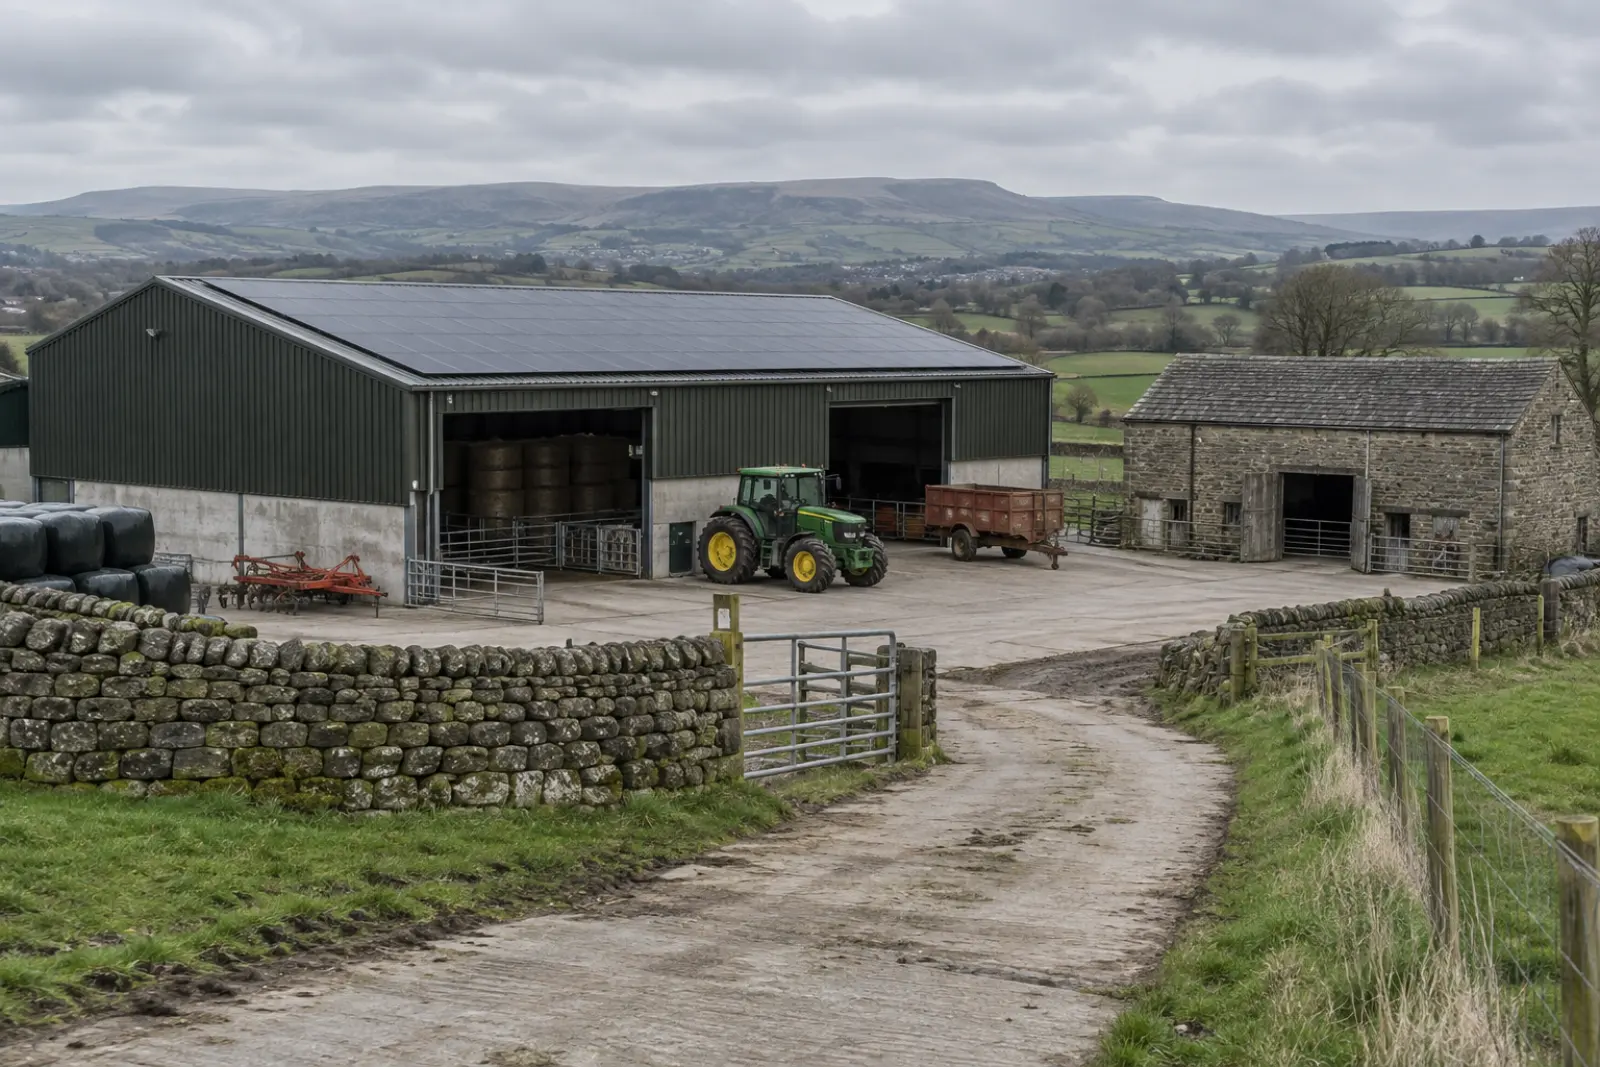
Solar for agricultural buildings across Greater Manchester
What a farm roof near Rochdale generates
Modelled irradiation at this latitude is 985 kWh per square metre a year in the plane of a shallow-pitched roof, which works out at 771 kWh for every kWp installed (EU PVGIS v5.2, SARAH3, 10 degree pitch, 14 percent system loss). That is about 13 percent below the mean across the areas we cover, so the case here rests on using the output on the holding rather than exporting it.
1 roof mounted scheme is on record nearby. Roof arrays under a megawatt frequently never reach that database at all, so the real number of farm roofs generating around Rochdale is higher than the record shows.
Surveys run across OL postcodes, OL11 outward.
Rochdale is the planning authority for most holdings here, and it is the authority that decides whether an array on an agricultural building falls inside permitted development.
Rochdale ranks 8 of 10 towns we cover in Greater Manchester on modelled yield, against a national mean of 886 kWh per kWp. The county runs from 769 to 828, a spread of 59 kWh per kWp. On a 500 kWp array that is about 29,500 kWh a year between the strongest and weakest town in the county.
Solar already consented near OL11
From the government's Renewable Energy Planning Database, Q1 2026. These are the schemes on record in this postcode district, which is a fair guide to how the local network has been treating export applications.
| Scheme | Operator | Capacity | Mounting | Status |
|---|---|---|---|---|
| Spotland Stadium, Sandy Lane - Solar Panels | Rochdale AFC | 0.15 MW | Roof | Awaiting Construction |
Grid connection through Electricity North West
Electricity North West is the network operator here, and their answer on export capacity shapes the design. Any commercial array above 3.68 kW per phase connects under G99 rather than G98, and the application fixes what you are allowed to push back onto the network. If the local network is tight, limiting export rarely breaks the case here: most of the generation is consumed on site while the building is working.
Across Greater Manchester the planning database records 118 solar schemes totalling 110 MW, of which 11 are operational (REPD Q1 2026).
Send us the postcode
Tell us where the unit is and roughly how big the roof is. We come back with what it can carry, what it would generate against your consumption, and the three ways to pay for it.
Lenzie Consulting Ltd arranges the survey and passes your details to our MCS-certified installation partner so they can quote.
Questions about solar in Rochdale
- Is there enough sun around Rochdale to make this work?
- Modelled at 771 kWh per kWp a year for a shallow-pitched roof at this latitude, which puts a 500 kWp array at roughly 386,000 kWh a year before shading. That array needs about 1,485 sqm of clear roof once ridge vents and walkways are allowed for. Source: EU PVGIS v5.2, SARAH3, 10 degree pitch, 14 percent system loss.
- Who do we apply to for export near Rochdale?
- Only Electricity North West can answer it for your connection, and on rural feeders the answer varies farm to farm. An export-limited offer usually still works, because a holding with grain drying, cooling or ventilation uses most of what it makes.
- Do we need planning permission in Rochdale?
- In most cases no, because panels on the roof of an agricultural building usually sit within permitted development. The exceptions are listed buildings, conservation areas, protected landscapes and arrays that stand proud of the roof. We check with Rochdale either way.