farmsolarpanels Solar for farm buildings, UK wide Book a roof survey

What your roof can carry, and what it would make

A commercial solar calculator converts roof area into array size and array size into generation. This one uses the modelled yield for your own town rather than a national average, because the difference across the country is about 46 percent and that is too large to average away.

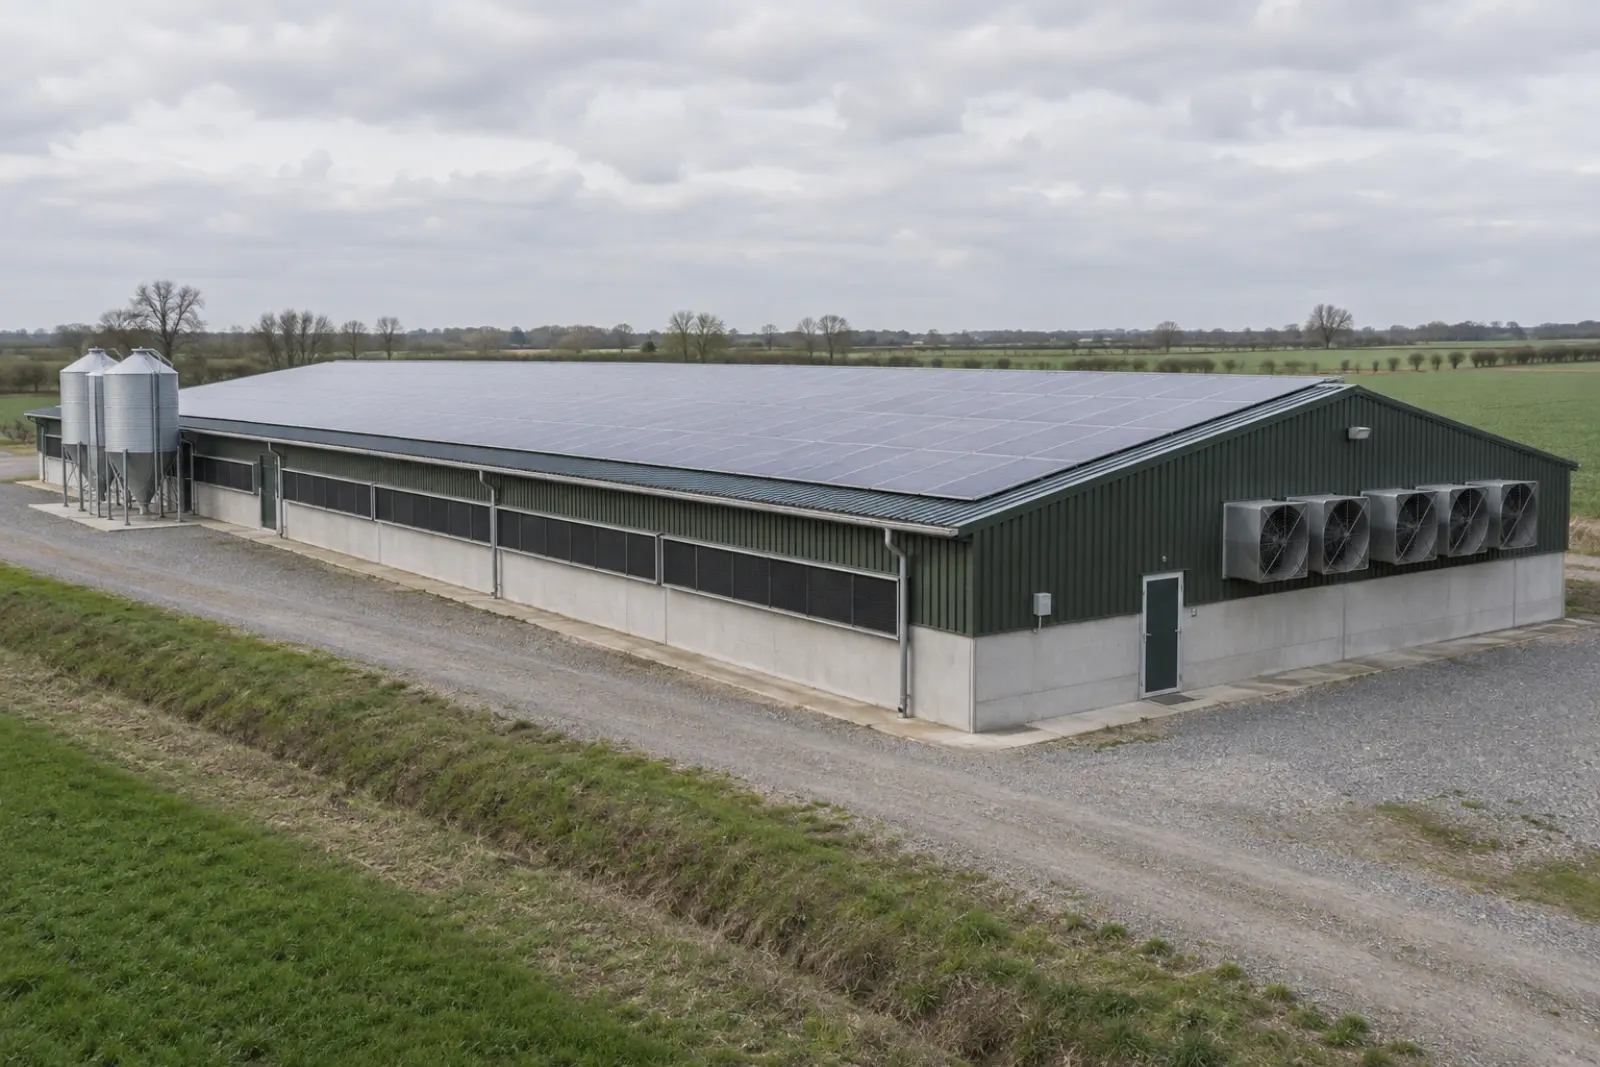
A long poultry unit with a broad shallow roof covered in solar panels, feed silos at one end
Usable area is what is left once ridge vents, rooflights and walkways come out. On a building like this it is often around two thirds of the footprint.

Modelled yield for this town, EU PVGIS v5.2

The whole roof. Deductions come next.

68%

What is left once rooflights, plant, walkways and setbacks come out.

Sets the share of generation used on site rather than exported.

p/kWh

From your bill, the delivered day rate. Leave blank to see kWh only.

p/kWh

Smart Export Guarantee rates vary by supplier.

FROM YOUR INPUTS Bolton, 801 kWh per kWp
Usable roof 3,400 m²
Array that fits 1,545 kWp
Modelled generation 1,237,000 kWh a year
Used on site 804,000 kWh
Exported 433,000 kWh

Modelled from the figures you entered, at the yield for that town. It is arithmetic, not a quotation: the roof survey replaces every line of it with measured numbers.

Book a roof survey

What the numbers mean

Array size

A kWp, or kilowatt peak, is the rated output of an array under standard test conditions, and it is the unit a quotation is priced against. Panels occupy roughly 2.2 square metres for each kWp installed, so usable area divided by 2.2 is the array the roof will take.

Modelled generation

Annual generation is the array size multiplied by the yield for your location. Yield here comes from EU PVGIS v5.2 for a shallow-pitched south-facing array with a 14 percent system loss, which is the standard assumption for a commercial roof.

The split

Self-consumption is the share of generation you use on site instead of exporting, and it is what decides the payback. The working patterns in the calculator are starting points; the survey measures it from twelve months of your own half-hourly data.

The money line

The value shown uses the unit rate you enter, from your own bill. We publish no price per kWp and no assumed tariff, because both move with the roof and the market. Export income depends on the Smart Export Guarantee rate your supplier offers.

Questions about the calculator

How accurate is a commercial solar calculator?
A calculator is arithmetic, not a survey. This one is accurate about the things it can know, which are the yield for your latitude and the way area converts into array size. It cannot know your purlin centres, your sheet condition, the shading from a neighbouring unit, or what your network operator will allow you to export, and those are what decide a real scheme. Treat the output as a sense check that tells you whether a survey is worth booking.
Why does the yield change when I change town?
Modelled yield is the electricity a one kWp array produces in a year at that latitude and climate, and across the towns we cover it runs from 704 to 1028 kWh per kWp. That spread is about 46 percent, so the same array on the same roof earns materially more in one place than another. Figures come from EU PVGIS v5.2, and every location page shows the number for that town.
How much of the roof is usable?
Usable area is the gross roof minus rooflights, plant, walkways, setbacks and anything shaded. On a modern farm building it is often around two thirds, but an older roof with plant clusters and multiple rooflight runs can be far less. The slider is there because it is the input that moves the answer most, and the survey replaces the guess with a measured layout.
Why does the calculator not show a price?
Price per kWp moves with roof condition, access, cladding profile, the grid application and the state of the market on the day. Any number we published here would be a guess dressed as a quotation. What the calculator does instead is give you the generation, and the value of that generation at a unit rate you supply from your own bill, so every figure in the money line is one you can check.
Next: what drives the cost, what the survey covers, or the yield for every town we cover across 48 counties. The mean across them is 886 kWh per kWp.