Solar panels for farms in Lydney
Farm buildings around Lydney carry broad, shallow roofs that were put up for storage and stock, not for generation. Each survey records the sheet type and condition, the usable area once rooflights and vents come out, and whether the supply is single or three phase.
905 kWh per kWp a year at this latitude, so a 500 kWp array models at about 453,000 kWh. Source: EU PVGIS v5.2, SARAH3, 10 degree pitch, 14 percent system loss.
Book a roof survey in LydneyIllustrative layout for a unit of this size. Your own figures come from the roof survey.
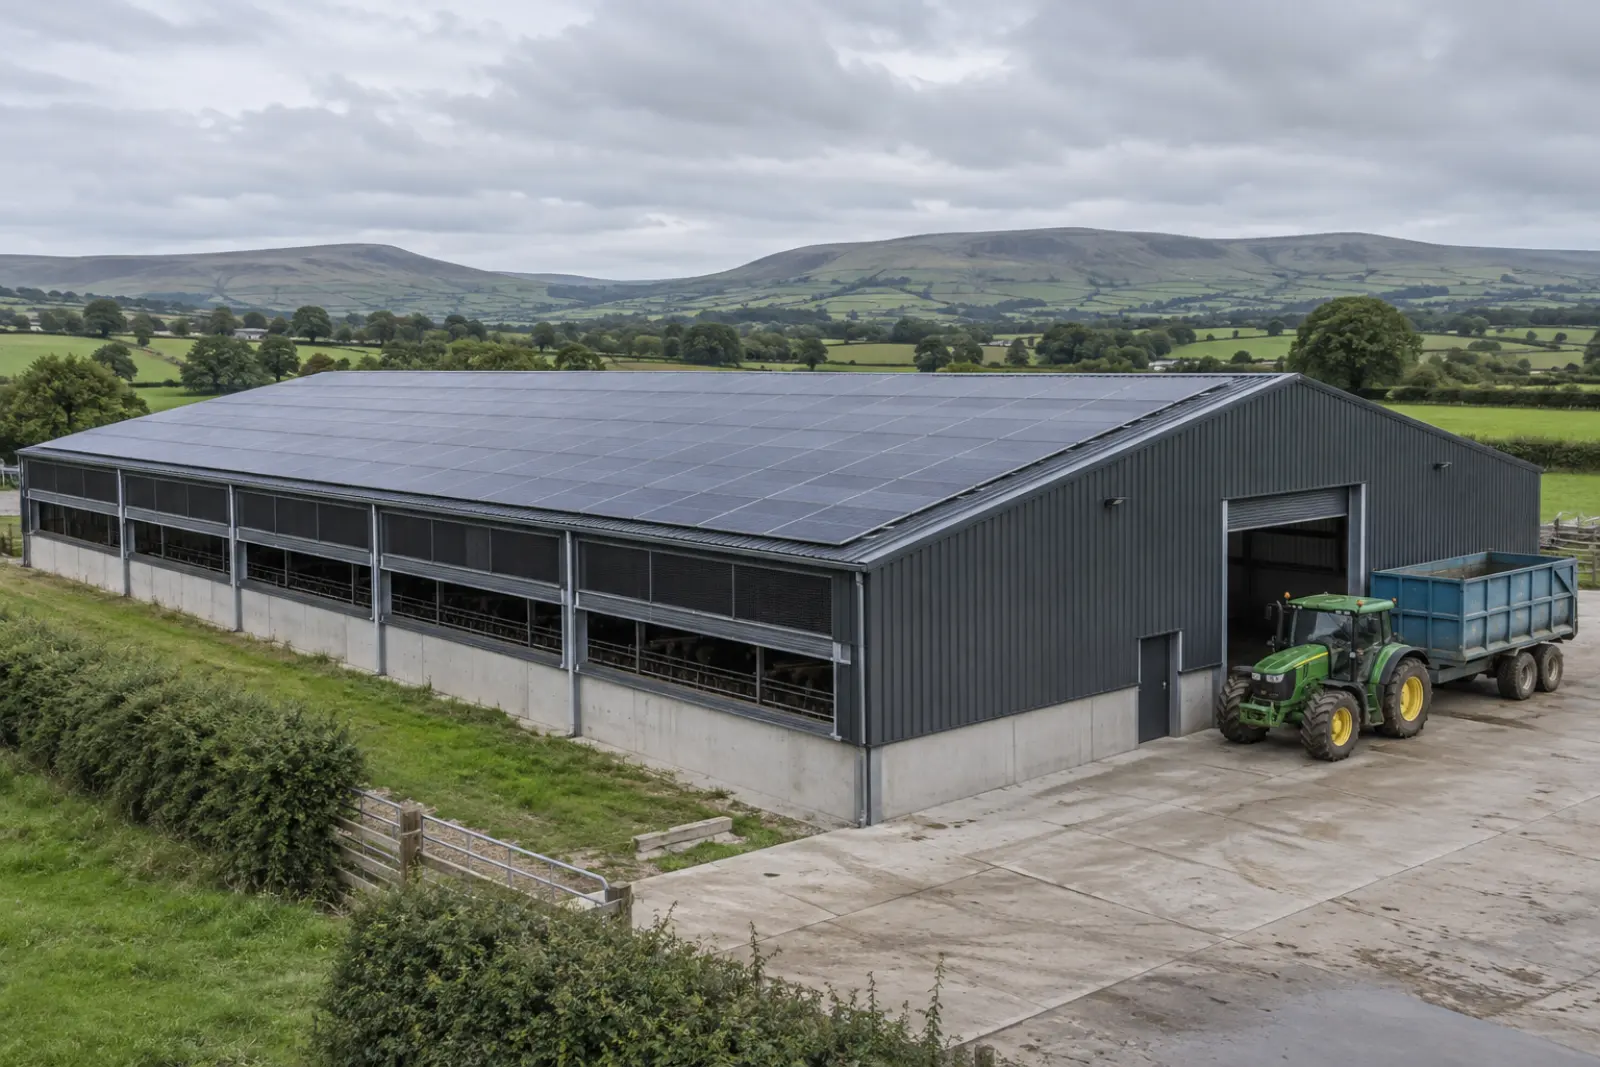
Farm building solar PV across Gloucestershire
What a farm roof near Lydney generates
Modelled irradiation at this latitude is 1162 kWh per square metre a year in the plane of a shallow-pitched roof, which works out at 905 kWh for every kWp installed (EU PVGIS v5.2, SARAH3, 10 degree pitch, 14 percent system loss). That sits within a few percent of the mean across the areas we cover, so what decides the scheme is your own demand pattern rather than the latitude.
No solar scheme is recorded in this postcode district in the planning database. On a farm that usually means nothing has been built above the reporting threshold rather than that nothing has been built, because a roof array on a shed rarely appears in it.
Lydney ranks 1 of 6 towns we cover in Gloucestershire on modelled yield, against a national mean of 886 kWh per kWp. The county runs from 870 to 905, a spread of 35 kWh per kWp. Within Gloucestershire that difference is small enough to ignore: where the building sits is not what decides this scheme, your consumption pattern is.
Grid connection through National Grid Electricity Distribution
National Grid Electricity Distribution is the network operator here, and their answer on export capacity shapes the design. Any commercial array above 3.68 kW per phase connects under G99 rather than G98, and the application fixes what you are allowed to push back onto the network. If the local network is tight, limiting export rarely breaks the case here: most of the generation is consumed on site while the building is working.
Across Gloucestershire the planning database records 207 solar schemes totalling 1592 MW, of which 39 are operational (REPD Q1 2026).
Send us the postcode
Tell us where the unit is and roughly how big the roof is. We come back with what it can carry, what it would generate against your consumption, and the three ways to pay for it.
Lenzie Consulting Ltd arranges the survey and passes your details to our MCS-certified installation partner so they can quote.
Questions about solar in Lydney
- How much does a farm roof near Lydney generate?
- The model gives 905 kWh for every kWp installed here, so 500 kWp comes out at about 453,000 kWh a year before shading losses. A building of roughly 1,485 sqm of clear roof carries it. Source: EU PVGIS v5.2, SARAH3, 10 degree pitch, 14 percent system loss.
- Will the rural network around Lydney take the export?
- National Grid Electricity Distribution is the distribution network operator for Gloucestershire. Anything above 3.68 kW per phase connects under G99, and the application sets the export limit. Rural supplies are often the binding constraint, so we ask the question before an array is sized.